In data teams, I’ve often met the objection that it’s not possible to demo “our product” for stakeholders.
“It’s just data flows, no one wants to see that”, or “How would we demo the ETL jobs we’ve been working on”, or “we’ve just been working on integrations with the new data platform, there is no UI (user interface) to show” etc.
If you’re not already doing this, regular demos are a great way to increase collaboration between different parts of an organization. For instance product and analytics teams.
From software teams I have learned it’s always possible and worthwhile to begin demoing something. No matter how small or technical. So the same principle should apply in a data team I thought when I first started my work with them. And I was right.
The most common argument against demos I’ve heard, from analytics and dev teams, is: “Demos are great for websites/mobile apps/fancy applications, but not for our <technical integrative operations data thing>.” (So, let’s keep working in silence..)
Since I also know stakeholders are more interested in details than most devs and analysts think, I'm not satisfied with that answer. Instead I ask the question:
“What have you been working on the last 2 weeks?”
“I have worked on this ETL job that reads traffic measurement observations from this source, computes and transforms it to these tables in the DW.”
“Ok, so can you show me what the ETL job looks like? Can you explain to me how it works, and what has changed?”
"Of course I can, here is the code and the SQL queries, I have changed it so that it now reads the new data, the boarding amount, as you see here. And then it converts these numbers to the codes we use in the dimension table, as you can see here. ”
“Thanks, and what does the end table look like, has it changed somehow?”
“Here it is, and no it hasn’t changed, instead we created this new table here.”
“Can you show me what that new table looks like?”
“Yes, wait a second. Here it is. And now you can see it includes the new boarding data.”
“Do you have any log files or monitoring or something that shows that the job is done?”
“Oh yes, here you can see the last successful run was yesterday.”
"Thanks! Now you have a great demo to show on Monday! Our planners and business developers will be happy to see that nothing changed in the old table and where they can get the new data. ”
Don’t underestimate your stakeholders interest in your work.
Don’t underestimate the power of visibility and transparency of your work.
Here is an example from a demo when I was working with a passenger counting team at SL (Stockholm Public Transport Authority):
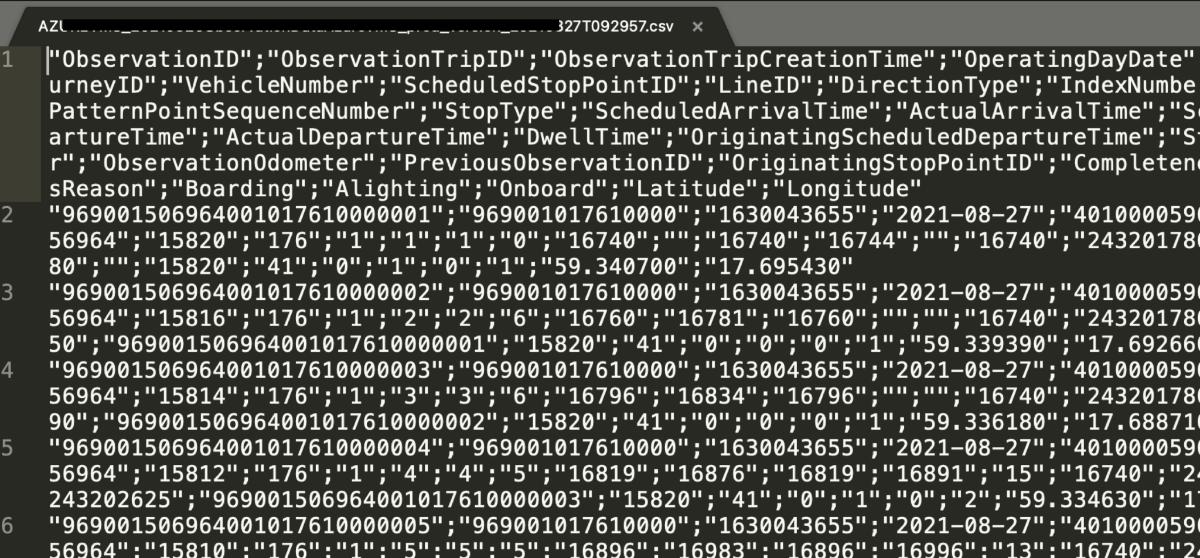
We hadn’t built the UI yet in our application for this specific data. But we still wanted feedback, before we had invested a lot of time in the UI. So we demo:ed the data we had got from a test and which we were about to integrate. And we did get feedback on these numbers! That saved a lot of time..
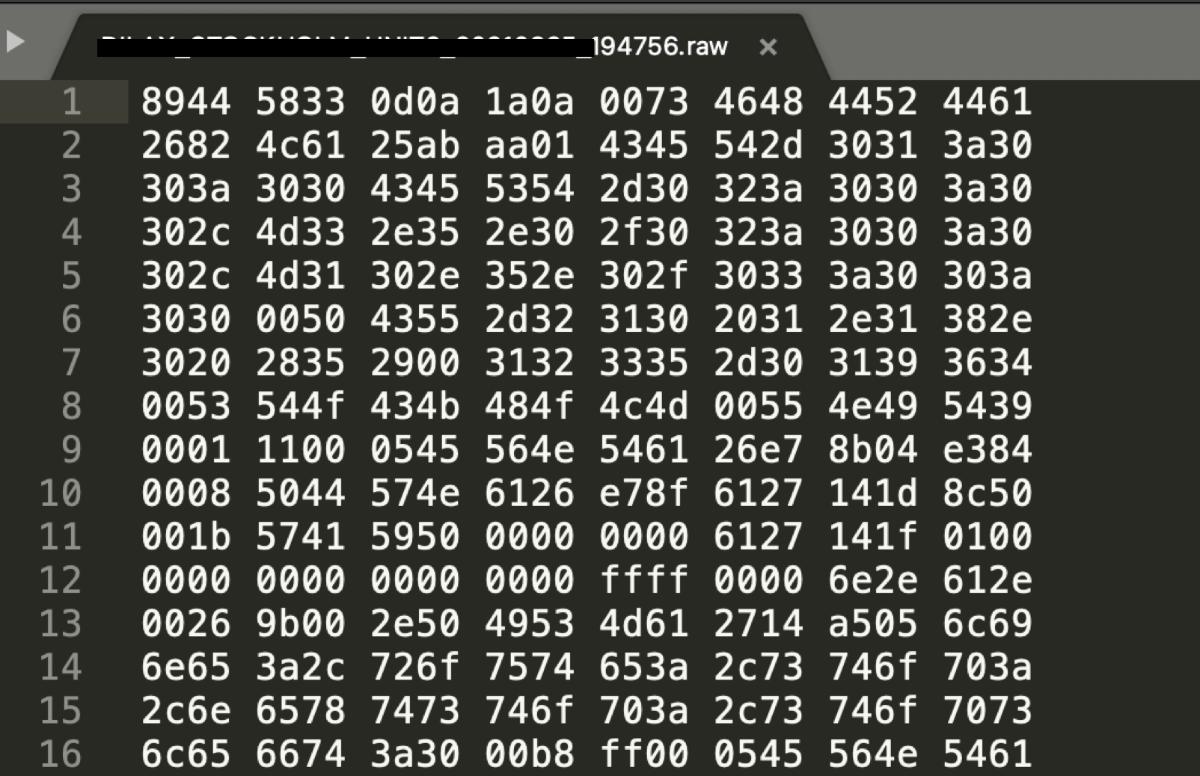
Here’s another thing we demo:ed; boarding data from an external sensor system that our application would transform to make useful. We wanted to show what we had to deal with. Our stakeholders got a bit more empathetic after this demo :-)
When you don’t have a fancy UI to show, what are the tools you use to see the results of your efforts? How do you know what’s going on with your data? Show those tools. Be it an SQL Editor, a Jupyter notebook, a CI/CD server, a monitoring software, Log files, DB tables, an IDE prompt..
If our stakeholders are not technical at all, is there something you can say or show that they can understand? Is there an end report or export that uses the new data, or something else that can be used.. ?
In this example, the Data/BI team had worked a lot to improve some integrations and fetching of data. How could we demo that for our stakeholders? It’s just data going between sender and recipient with more reliability..
So we demo:ed the monitoring ui, where the old results of imports and new results could be compared.
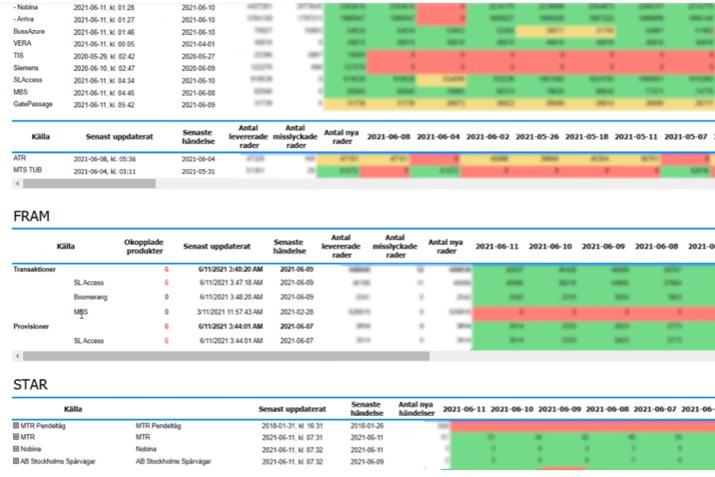
The stakeholders were really happy to see the result. And to just know what we worked on. Red runs had become green. Numbers of successfully imported rows had increased etc.
I’ve had team members, data scientists and analysts, who have become masters of explaining complicated data flows in ways that anyone can understand.
If we want to have better collaboration with our stakeholders, for whatever reason, a starting point is the demo. If we can’t proudly show our work to those who use the result, who finance it or influence it, how could we expect to collaborate around it?
The first time, the demo might not be perfect. It might be boring or messy. But most teams do get better each time. And it is a door opener for communication, feedback and conversations.
Read also my post about collaboration between analyst & product teams:
Ulrika Vincent 

Ulrika has a background as a software developer, product leader & analyst, manager, agile mentor and other roles in digital development. Last couple of years she’s developed her coding skills in data analytics, statistics & Python. She has been working with several popular mobile apps, web services & other platforms in Sweden such as Res I Sthlm, Travis, SL, Expressen, KTH, Fritidsresor (TUI), Coop, Lantmännen and SoapUI.
Ulrika has a passion for problem solving, data driven work and understanding the users real needs. She encourages self directing and cross functional work, testing, open data and learning.
You can contact her for open questions or support within digital product development
- E-post: ulrika@agical.se
- LinkedIn: Ulrika Vincent